ECU Security Testing Platform · v1.0

Professional fuzzing for
real or virtual Embedded Devices

Ywatch is a desktop fuzzing platform built for professional security engineers. Connect to any ECU over CAN, run intelligent protocol-aware mutations, capture bus traffic, and get professional HTML reports — all from a single GUI.

CAN / CAN-FD UDS · ISO 14229 SOME/IP · AUTOSAR DoIP · ISO 13400 .dbc / .arxml / .cdd

What Ywatch does

Everything you need to fuzz an ECU

From first connection to final report — one integrated desktop tool, no cloud dependency required.

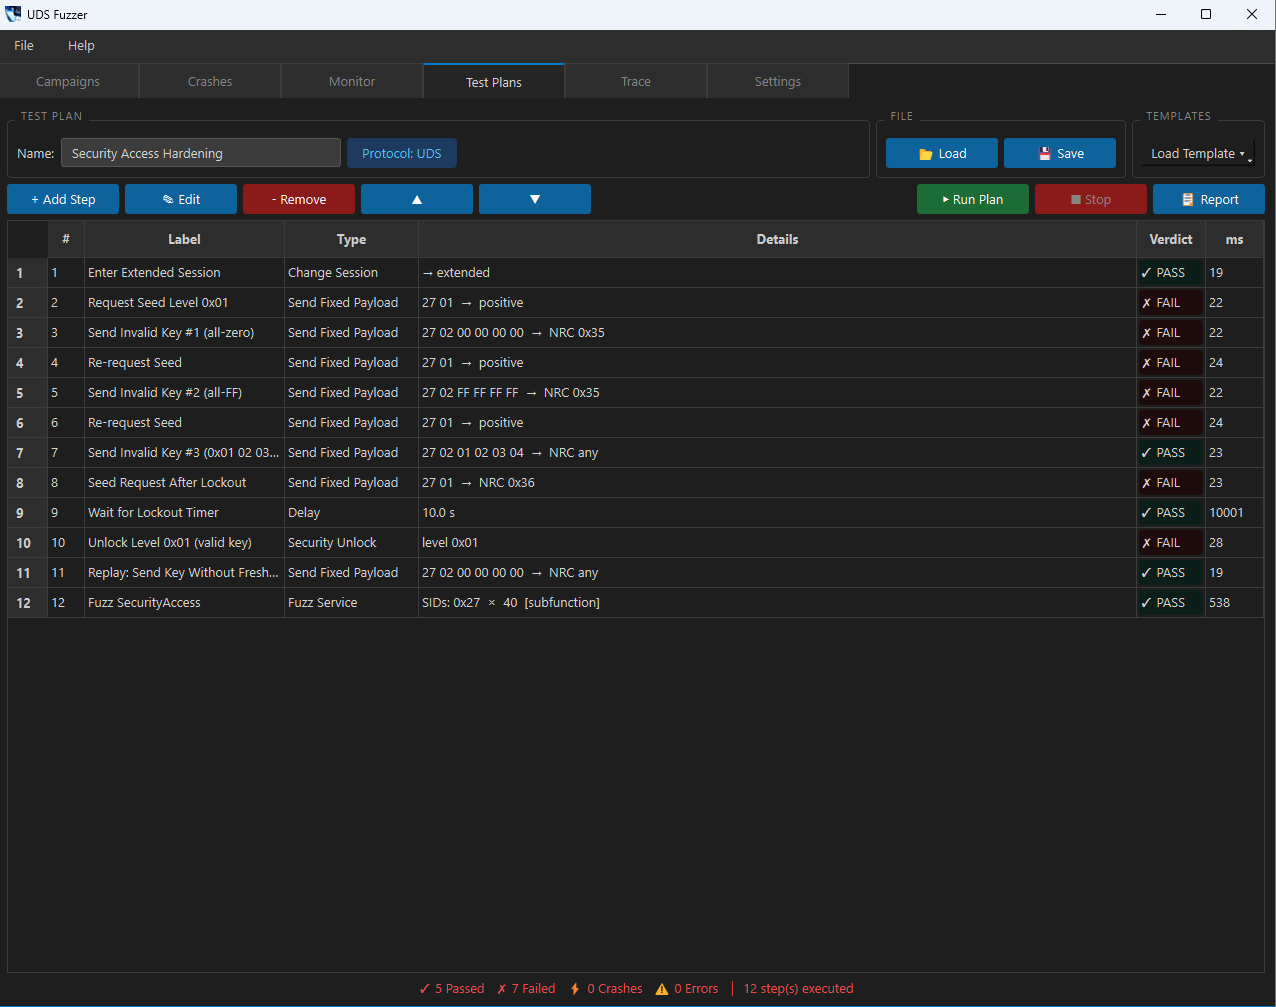
Visual Test Plan Builder

Build structured test plans through a GUI wizard. Define UDS service sequences, expected responses, and verdict rules (PASS / FAIL / CRASH). Save, reload, and share plans as YAML files across your team.

Database-Guided Fuzzing

Import your vehicle network database (.dbc, .arxml, .cdd) and Ywatch automatically generates targeted payloads — boundary values, enum sweeps, and out-of-range mutations based on real signal definitions. No manual scripting.

CANoe-Style CAN Trace

Live CAN bus capture with real-time signal decoding. Load a .dbc or .arxml to see decoded values inline. Filter by message name or ID. Export to CANoe-compatible .asc format. Live signal value panel updates as frames arrive.

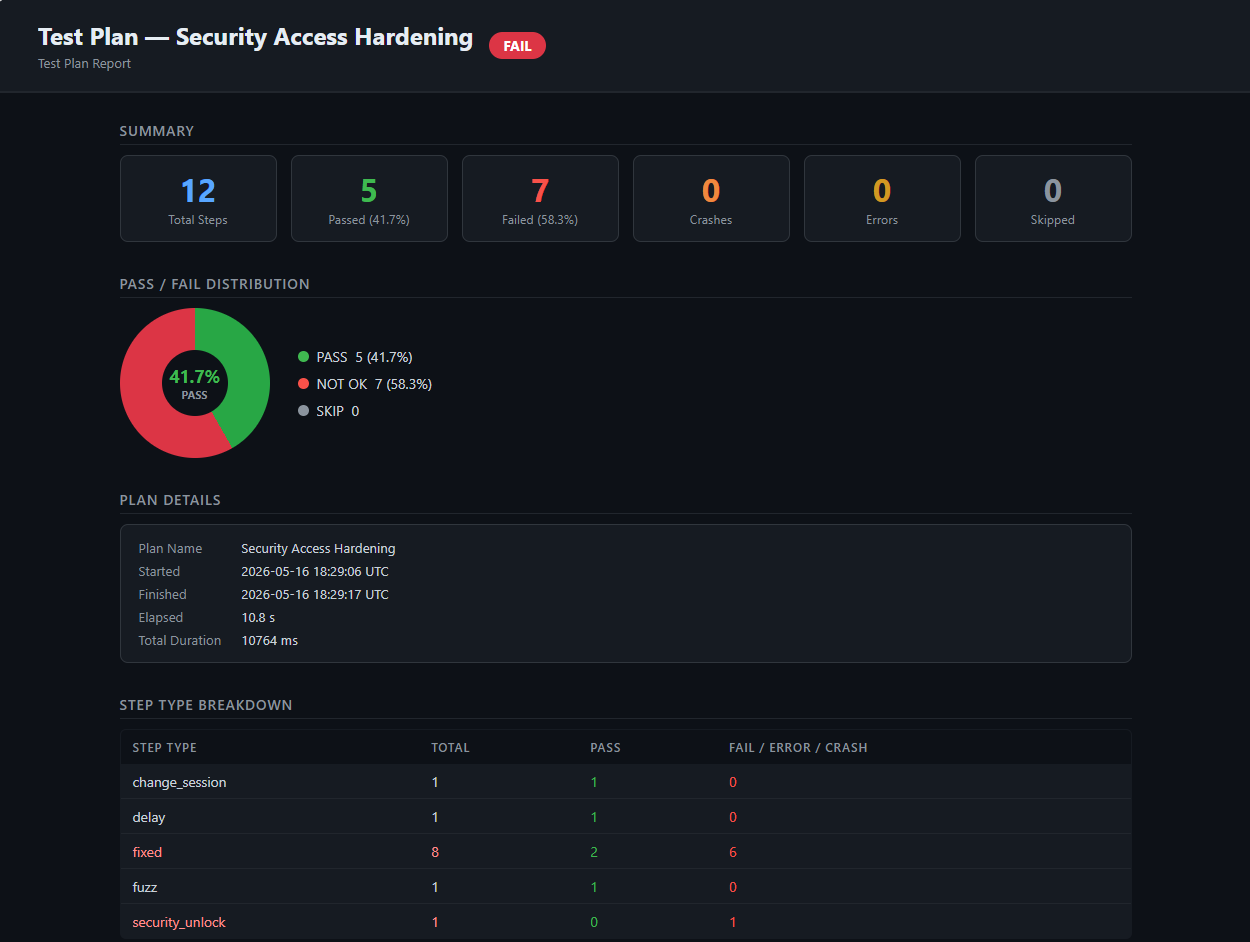
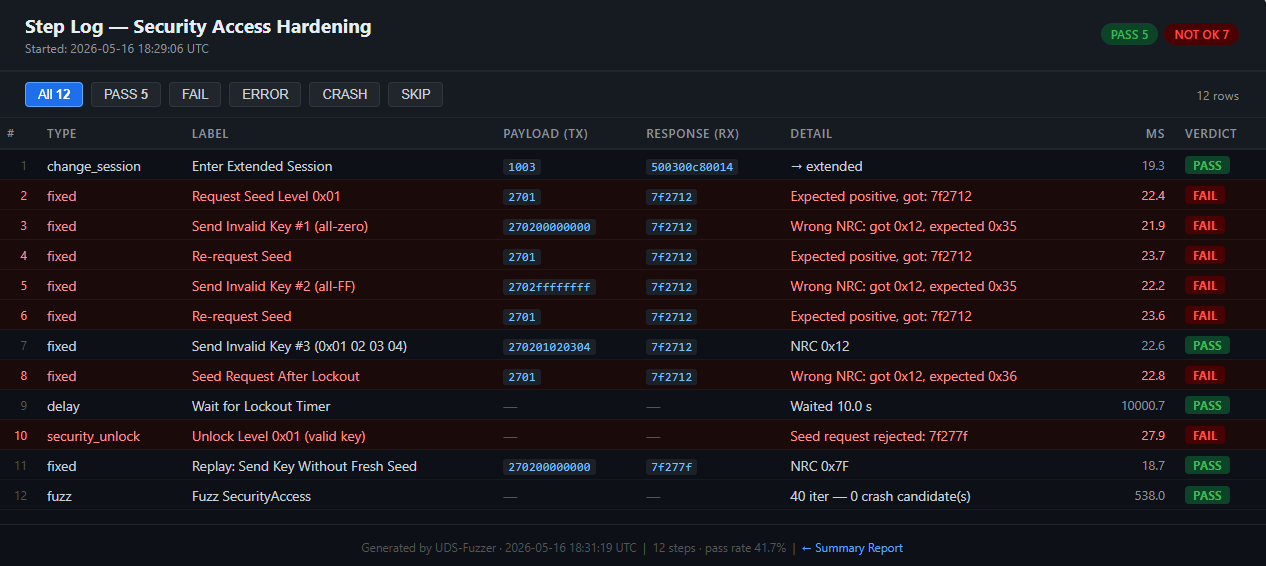
Professional HTML Reports

One-click report generation for both fuzz campaigns and test plan runs. Each report produces four artefacts: JSON data, Robot Framework XML, a summary HTML report with donut chart, and a per-step HTML log with PASS / FAIL / CRASH badges.

Real-Time Crash Monitor

Dedicated monitor tab streams live events during fuzzing. Detects ECU silence, unexpected resets, and protocol anomalies. Crash events are automatically stored in a searchable database with the exact reproducing payload.

Replay & Crash Triage

Stored crashes include all context needed for reproduction. The built-in replay engine replays any crash payload directly to the target — no manual reconstruction. Filter, sort, and export the crash database from the Crashes tab.

Smart Mutation Pipeline

Layered mutator pipeline: SID mutation, subfunction sweep, length boundary fuzzing, timing manipulation, sequence mutation, and database-guided signal boundary fuzzing. Each layer runs in order and is individually configurable per campaign.

Multi-Interface CAN Support

Works with all major CAN adapters: PCAN, Vector (VN/CANcase), Kvaser, IXXAT, SocketCAN, and virtual interfaces for offline development. Configurable channel, bitrate, and ISO-TP addressing in the Settings tab.

Compliance-Ready Output

Reports support UN R155 (CSMS) and ISO/SAE 21434 clause 9.3 fuzz testing work products. Robot Framework XML output integrates directly into test management systems (ALM, Polarion, Jira Xray).

Protocol Coverage

Automotive · Industrial · Medical

Ywatch understands deep protocol semantics for embedded device security testing — whether it's a CAN‑based ECU, a Profinet industrial controller, or a medical IoT wearable.

Automotive protocols

UDS — ISO 14229

over ISO-TP / CAN
  • Service ID (SID) sweep — all 0x00–0xFF with valid/invalid subfunctions
  • Data Identifier (DID) fuzzing — Read / Write / IOCBI
  • Security Access seed/key exchange and bypass attempts
  • Timing attacks — P2, P2*, TesterPresent interval manipulation
  • Negative Response Code (NRC) validation and unexpected code detection

CAN / CAN-FD + ISO-TP

Classic and FD up to 8 Mbps
  • Arbitration ID fuzzing across the full 11-bit / 29-bit range
  • DLC boundary mutations (0 to 8 / 64 bytes)
  • ISO-TP segmentation edge cases — multi-frame, flow control manipulation
  • Database-driven signal boundary testing from .dbc / .arxml / .cdd
  • Live trace capture with CANoe-compatible .asc export

SOME/IP — AUTOSAR

over UDP / TCP
  • Header field mutation — Service ID, Method ID, Client ID, Session ID
  • Message type and return code fuzzing
  • Payload length boundary cases
  • Interface version mismatch injection

DoIP — ISO 13400-2

Diagnostics over IP / Ethernet
  • Gateway IP / logical address configuration
  • UDS payloads tunnelled over DoIP transport
  • Connection routing manipulation
  • Source / target logical address fuzzing

Industrial protocols (factory, PLC, robotics)

Profinet / PROFIBUS

Real-time Ethernet & legacy fieldbus
  • Profinet IO‑controller / device cycle data fuzzing
  • DCP (discovery & configuration) protocol abuse
  • Alarms and diagnostics block mutation
  • PROFIBUS DP parameterization and configuration attack surface

EtherCAT

High-speed motion control
  • Fuzzing the EtherCAT frame header (command, index, IRQ)
  • Mailbox protocol (CoE, SoE) service fuzzing
  • Process data mapping and watchdog manipulation
  • Distributed clock synchronisation attack vectors

Modbus TCP / RTU

Universal SCADA & PLC protocol
  • Function code sweep (1..255) with malformed data frames
  • Address and quantity boundary fuzzing (register overflow)
  • Exception code injection and response parsing
  • Modbus encapsulation on serial RTU (timing, parity errors)

OPC UA

Industry 4.0 data exchange
  • Fuzzing of OPC UA binary encoding (extension objects, variants)
  • Service call fuzzing — Read, Write, Browse, Call
  • Node ID and namespace injection
  • Certificate and user token authentication bypass attempts

Medical & wearable protocols

Bluetooth LE (BLE)

Wearables, continuous monitors
  • GATT attribute fuzzing — handle, type, value bounds
  • Advertisement packet injection and length overflows
  • L2CAP connection parameter manipulation
  • Pairing and bonding process downgrade attacks

Wi-Fi (802.11)

Hospital bed monitors, infusion pumps
  • Management frame fuzzing (beacon, probe, association)
  • EAP‑TLS / PEAP authentication fuzzing
  • 4‑way handshake timing and replay attacks
  • Deauthentication flood and channel hopping injection

Cellular (LTE‑M, NB‑IoT)

Remote patient monitoring
  • NAS protocol fuzzing (attach, TAU, authentication)
  • RRC connection establishment and release flood
  • PDU session establishment malformed requests
  • SIM APDU boundary and command injection

ISO/IEEE 11073 (x73)

Medical device interoperability
  • MDS (Medical Device System) object fuzzing
  • PM‑Store and metric attribute boundary injection
  • Service model — GET, SET, ACTION, EVENT REPORT abuse
  • Association and release procedure manipulation

Regulatory compliance: Ywatch test plan reports and campaign logs serve as evidence artefacts for UN R155 (automotive CSMS), ISO/SAE 21434 clause 9.3, IEC 62443 (industrial security), and FDA pre-market guidance for medical device cybersecurity. Export to Robot Framework XML for ALM integration.

Output & Reporting

From raw frames to audit-ready reports

Every campaign and test plan run generates a full artefact set — interactive HTML, machine-readable JSON, and Robot Framework XML — in one click.

Ywatch test plan builder GUI
Test Plan Builder
Ywatch HTML campaign report
HTML Campaign Report
Ywatch HTML step log
Detailed Step Log

Summary donut chart

Pass / Fail / Crash / Error / Skip breakdown at a glance

Filterable step log

Filter per-request results by verdict type with one click

4 export formats

HTML report · HTML log · Robot Framework XML · JSON

Crash replay

Reproduce any finding with a single button — no manual reconstruction

Workflow

Up and running in minutes

Ywatch is a standalone Windows/Linux desktop application. No cloud account, no setup server — just install and connect your CAN adapter.

1

Connect your CAN interface

Open Settings and select your adapter (PCAN, Vector, Kvaser, IXXAT, SocketCAN). Set channel, bitrate, and ISO-TP TX/RX addressing for your target ECU. Settings are persisted across sessions.

2

(Optional) Load your vehicle database

Import a .dbc, .arxml, or .cdd file. Ywatch parses all signal definitions and builds targeted mutation payloads automatically. Also used in the Trace tab for live signal decoding.

3

Build a test plan or start a fuzz campaign

Use the Test Plans tab to define structured UDS sequences with pass/fail criteria. Or go straight to Campaigns for continuous fuzzing with the full mutation pipeline. Monitor live in the Monitor tab.

4

Analyse crashes and generate reports

The Crashes tab lists every detected anomaly with its exact reproducing payload. Click Report in any tab to generate the full HTML + XML + JSON artefact set in one click. Attach directly to your work product or defect ticket.

5

Capture and export CAN bus traffic

Switch to the Trace tab for a CANoe-style live view of all bus traffic. Filter by message or ID, watch live signal values update in real time, and export the full session as a .asc file compatible with Vector CANoe and CANalyzer.

Pricing

Start for free, then talk to us

Ywatch is in early access. Try the full product free for 30 days — no credit card needed.

AVAILABLE NOW

Free Trial

$0/ 30 days
  • Full feature access — no limitations
  • All protocols: UDS, SOME/IP, DoIP
  • Database-guided fuzzing (.dbc/.arxml/.cdd)
  • CAN Trace tab + .asc export
  • HTML + XML + JSON reporting
  • Email support during trial
Request trial access →

Commercial License

Custom
  • Perpetual or annual licensing
  • On-premise deployment (no cloud)
  • Multi-seat team licenses
  • Dedicated onboarding & training
  • Priority support & SLA
  • ISO 21434 compliance assistance
Contact us for pricing →

Ywatch is a desktop application — your data stays on your machine. No telemetry, no cloud dependency.

Get access

Request your free trial

Fill in the form and we will get back to you within 24 hours with your trial licence.

No credit card. No spam. We will reply within 24 h.